Get quickly up to speed with the various metrics for analyzing portfolios.
Expected Return
Expected return refers to the anticipated gain or loss that you expect from an investment over a specified period of time. Within the Fabric application, we present the expected return for a portfolio for a period of 1 year.
The computation of this metric starts with the Capital Market Assumptions (CMAs) that the user has set within the Fabric application. Using these CMAs, Fabric then computes the expected return for the portfolio using the following formula.

Within the Fabric application, the user can specify CMAs at any level of granularity they desire: if the CMAs are specified at the level of broad asset classes --- equities, fixed income, alternatives --- the Fabric application applies these CMAs to each asset within those asset classes. These individual asset CMAs are then used to compute the expected return for the portfolio. Learn more on how to set your custom CMAs here.
Volatility
Volatility refers to the degree of variation or fluctuation in the price of a financial asset over time. It is one measure of the uncertainty or risk associated with an investment. In simpler terms, volatility indicates how much the price of an asset can potentially be over a given period of time.
Volatility is measured as the standard deviation of the returns of a portfolio. Within the Fabric application, volatility and other risk measures are calculated using MSCI's Multi-Asset Class (MAC) Factor Models. Take a deeper dive into the world of factor models here.
To compute the volatility of a portfolio of assets, we first compute the variance of the portfolio as follows:
where the Covariance measures the degree of co-movement between assets i and j. We can compute the covariance between any two assets using the factor model.
From the portfolio variance, the portfolio volatility can be computed as:
Within the Fabric application, we provide the volatility of the portfolio over the period of 1 year. Note that just like expected return, this is a forward-looking metric.
Maximum Drawdown
Maximum drawdown is used to measure the largest loss an investment or portfolio has experienced from its peak value to its lowest point. It helps us as investors to understand the potential downside risk associated with our investments. It is generally used as a complementary measure of volatility.
Within the Fabric application, we compute the maximum drawdown using factors. We first simulate 1000 forward-looking factor paths. Combining it with the exposure information for the assets in a portfolio, as well as their allocations within the portfolio, we can compute the maximum possible drawdown a portfolio can undergo, over the next year.
Sharpe Ratio
The Sharpe Ratio is a measure used to evaluate the risk-adjusted return of an investment.
The Sharpe Ratio takes into account both the return of an investment and the level of risk associated with it. In simple terms, the Sharpe Ratio measures how much excess return an investment generates per unit of risk.
To calculate the Sharpe Ratio, the average return of the investment is subtracted from the risk-free rate (such as the return on a government bond) and divided by the standard deviation of the investment's returns. The resulting ratio represents the additional return earned for each unit of risk taken.
Within the Fabric application, the Sharpe ratio is computed by dividing the expected return of a portfolio and the expected volatility of this same portfolio. We have already described how we compute the expected return and volatility above. Note that this is not the realized sharpe ratio for the portfolio, but its expected value.
Generally, the excess return over a benchmark risk-free rate is used for computing the Sharpe ratio. The risk-free rate is generally chosen to be a representative rate of return on a (relatively) risk-free asset, typically US treasuries. Once a risk-free rate is known, we can compute the Sharpe ratio for a portfolio as follows:

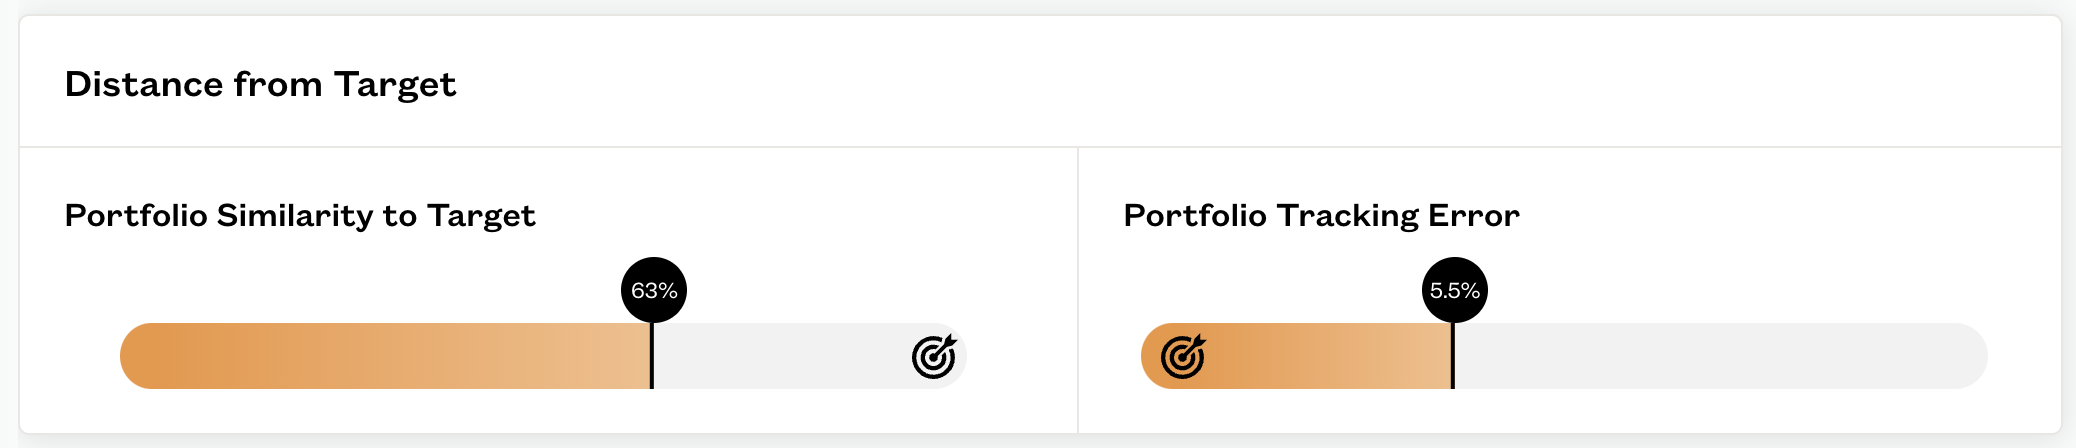
Portfolio Tracking Error
Portfolio tracking error is a measure used to assess the deviation of a portfolio's performance from a benchmark portfolio. Typically, portfolio tracking error is used to evaluate the performance of portfolio managers or investment strategies.
Within the Fabric application, users can evaluate how well one of their client portfolios is aligned with its associated target portfolio.
To calculate the ex-ante portfolio tracking error, we use the factor exposures for the portfolio and its associated target along with the factor covariance matrix. This provides an estimate of how much the client portfolio's returns might deviate from its associated target portfolio. A higher tracking error implies a larger deviation from the target portfolio.
Similarity to Target
The similarity to target or similarity score quantifies the resemblance between the client and target portfolios' factor risk contributions. It involves comparing the risk contributions of the two portfolios on a factor-by-factor basis, taking the differences, and then normalizing the results to yield a score between 0 and 100%. A detailed definition of the similarity score is available here. Key features of this score include:
-
Weighting of Differences: Larger differences between factors are given more weight than smaller differences.
-
Volatility Contribution: The similarity score is based on the percent contribution to volatility, not the absolute level of volatility, allowing for independent control of a portfolio's volatility.
-
Normalization: The normalization process is nonlinear, ensuring granularity for assessing both highly similar and dissimilar portfolios.
-
Exclusion of Idiosyncratic Risk: The score does not take into account asset-specific risk, such as idiosyncratic or selection risk.
-
Relation to Tracking Error: Although related, the similarity score is distinct from the tracking error. A low tracking error implies high similarity, but high similarity may not necessarily be accompanied by a low tracking error, depending on the portfolio's leverage and selected securities.
Comments
0 comments
Please sign in to leave a comment.